

Success Story
OYO Skincare: Monthly Revenue Up 113% to £53.9k in 60 Days
OYO Skincare was stuck at about £20k a month. In our second month the store made £53,884, up 113%, and conversion rate rose to 2.96%.
Reading time: 4 mins · Published
Overview
The founder started the brand after struggling to find all-natural, effective skincare for intimate areas. The product is a simple three-step routine of cleanser, scrub and oil for pubic skin and hair, bought mostly by women. The store launched in October 2021 and, with the help of a media buyer, quickly reached around £20,000 a month.
Challenge
Then growth stopped. The founder came to us with one question: “I can’t go above £20k per month. Can you help?” She did not need another media buyer. She needed a team covering brand communication, creative strategy and production, conversion rate optimisation and business development.
Intimate skincare is a hard category to advertise. Shaving and the bikini line are sensitive subjects for Facebook’s ad review and for the audience alike. The account itself was set up reasonably well, but it had no repeatable process for testing audiences and creatives, no proper remarketing, and weak conversion through the whole customer journey.
We started in March 2022, with a Facebook budget of £8k a month.
What we did
Funnel and offer.
- We added a subscription option. It created a new revenue stream and lowered the cost of acquiring each customer. We tested it organically first, with no ads pointing at it, to see how many people would choose it on their own.
- We launched a referral campaign, which grew the email list by 30% in under 60 days.
- We supported the founder’s product quiz with a conversion campaign optimised for purchases. Shoppers saw their results and recommended products on the quiz page itself.
Conversion rate optimisation. We rebuilt the key pages in Shogun so they could change without developer time, and backed every change with an A/B test.
- Product pages: more customer UGC, clearer USP and benefit-led copy, better imagery, reviews and a sticky add-to-cart button. We also tested price points to find the balance between conversion and margin.
- Collection pages: the three-product bundle up front to raise order value, plus before-and-after images to build trust.
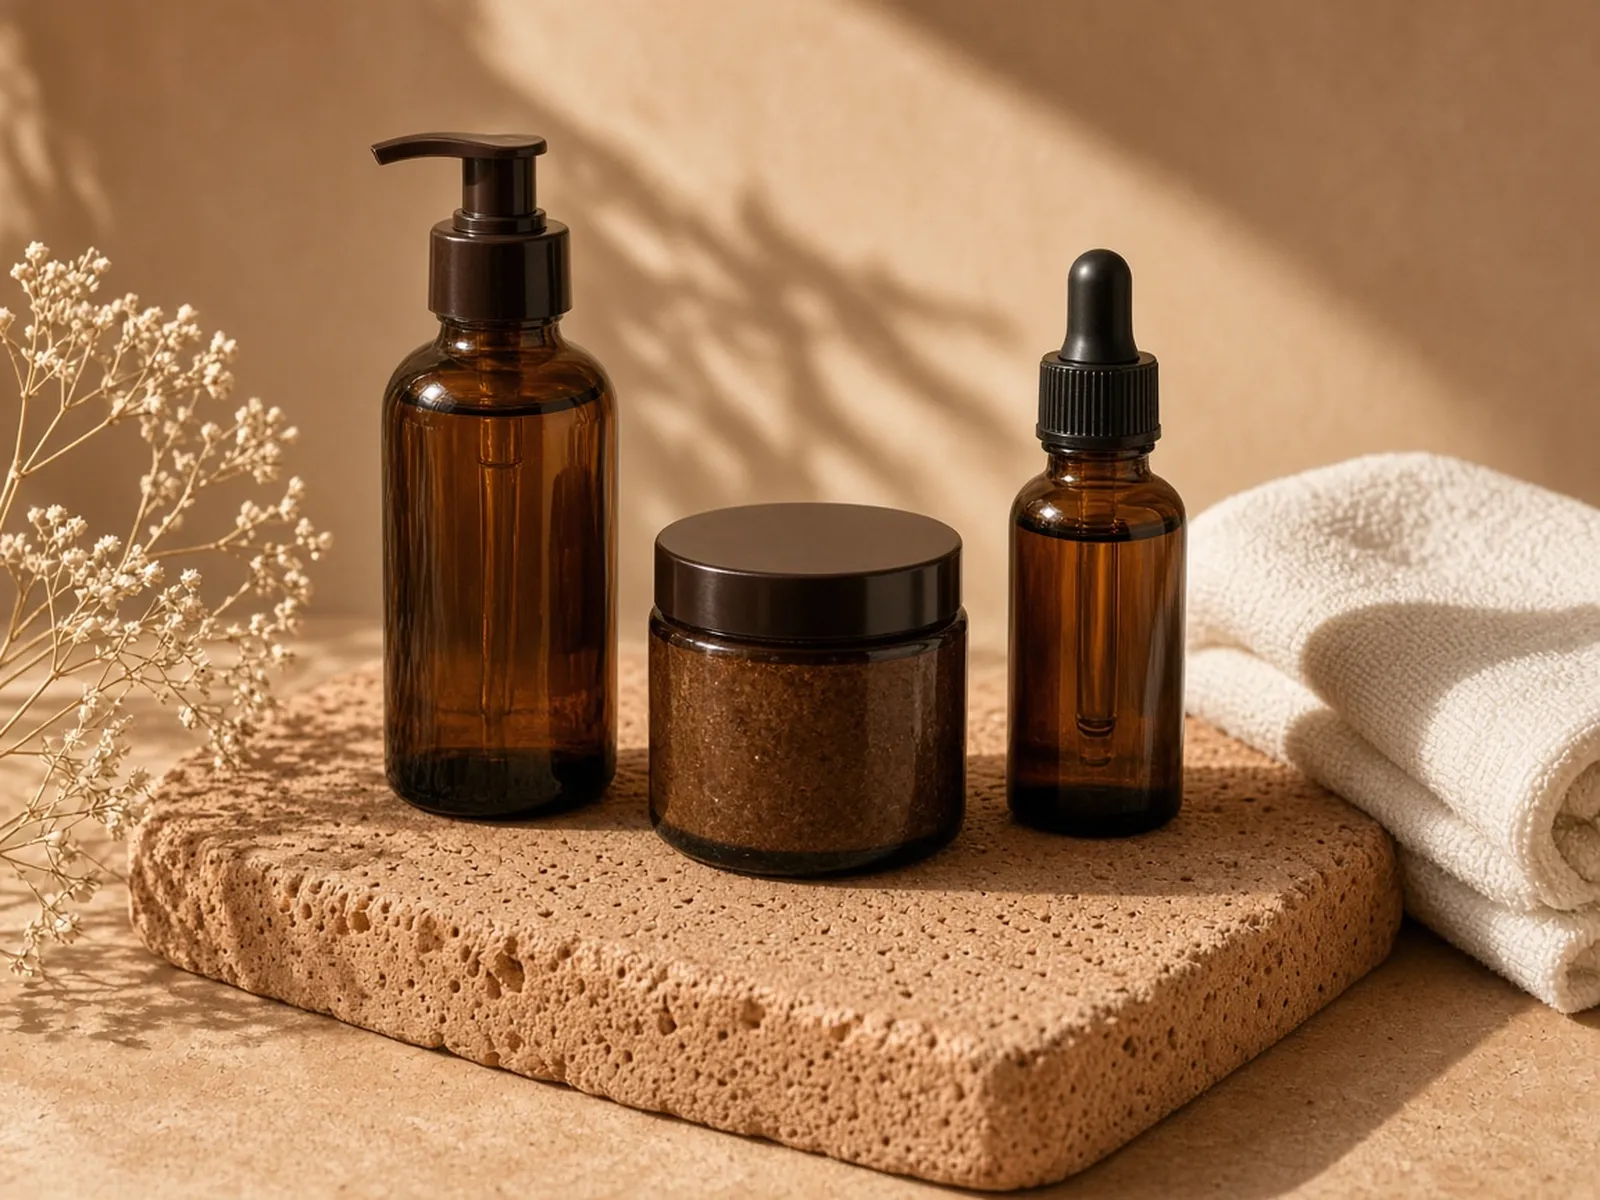 An all-natural three-step routine: cleanser, scrub and oil (illustrative product photo).
Creative strategy. We wrote hypotheses from market research and the product’s USP, scaled the winners, then mixed the brand’s existing winners with new concepts. We started with testimonial and before-and-after ads. The ads that worked were honest and helpful: they showed how simple the routine is, which also positioned the full three-step bundle as the obvious buy and lifted order value. We also used TikTok-style videos on Facebook.
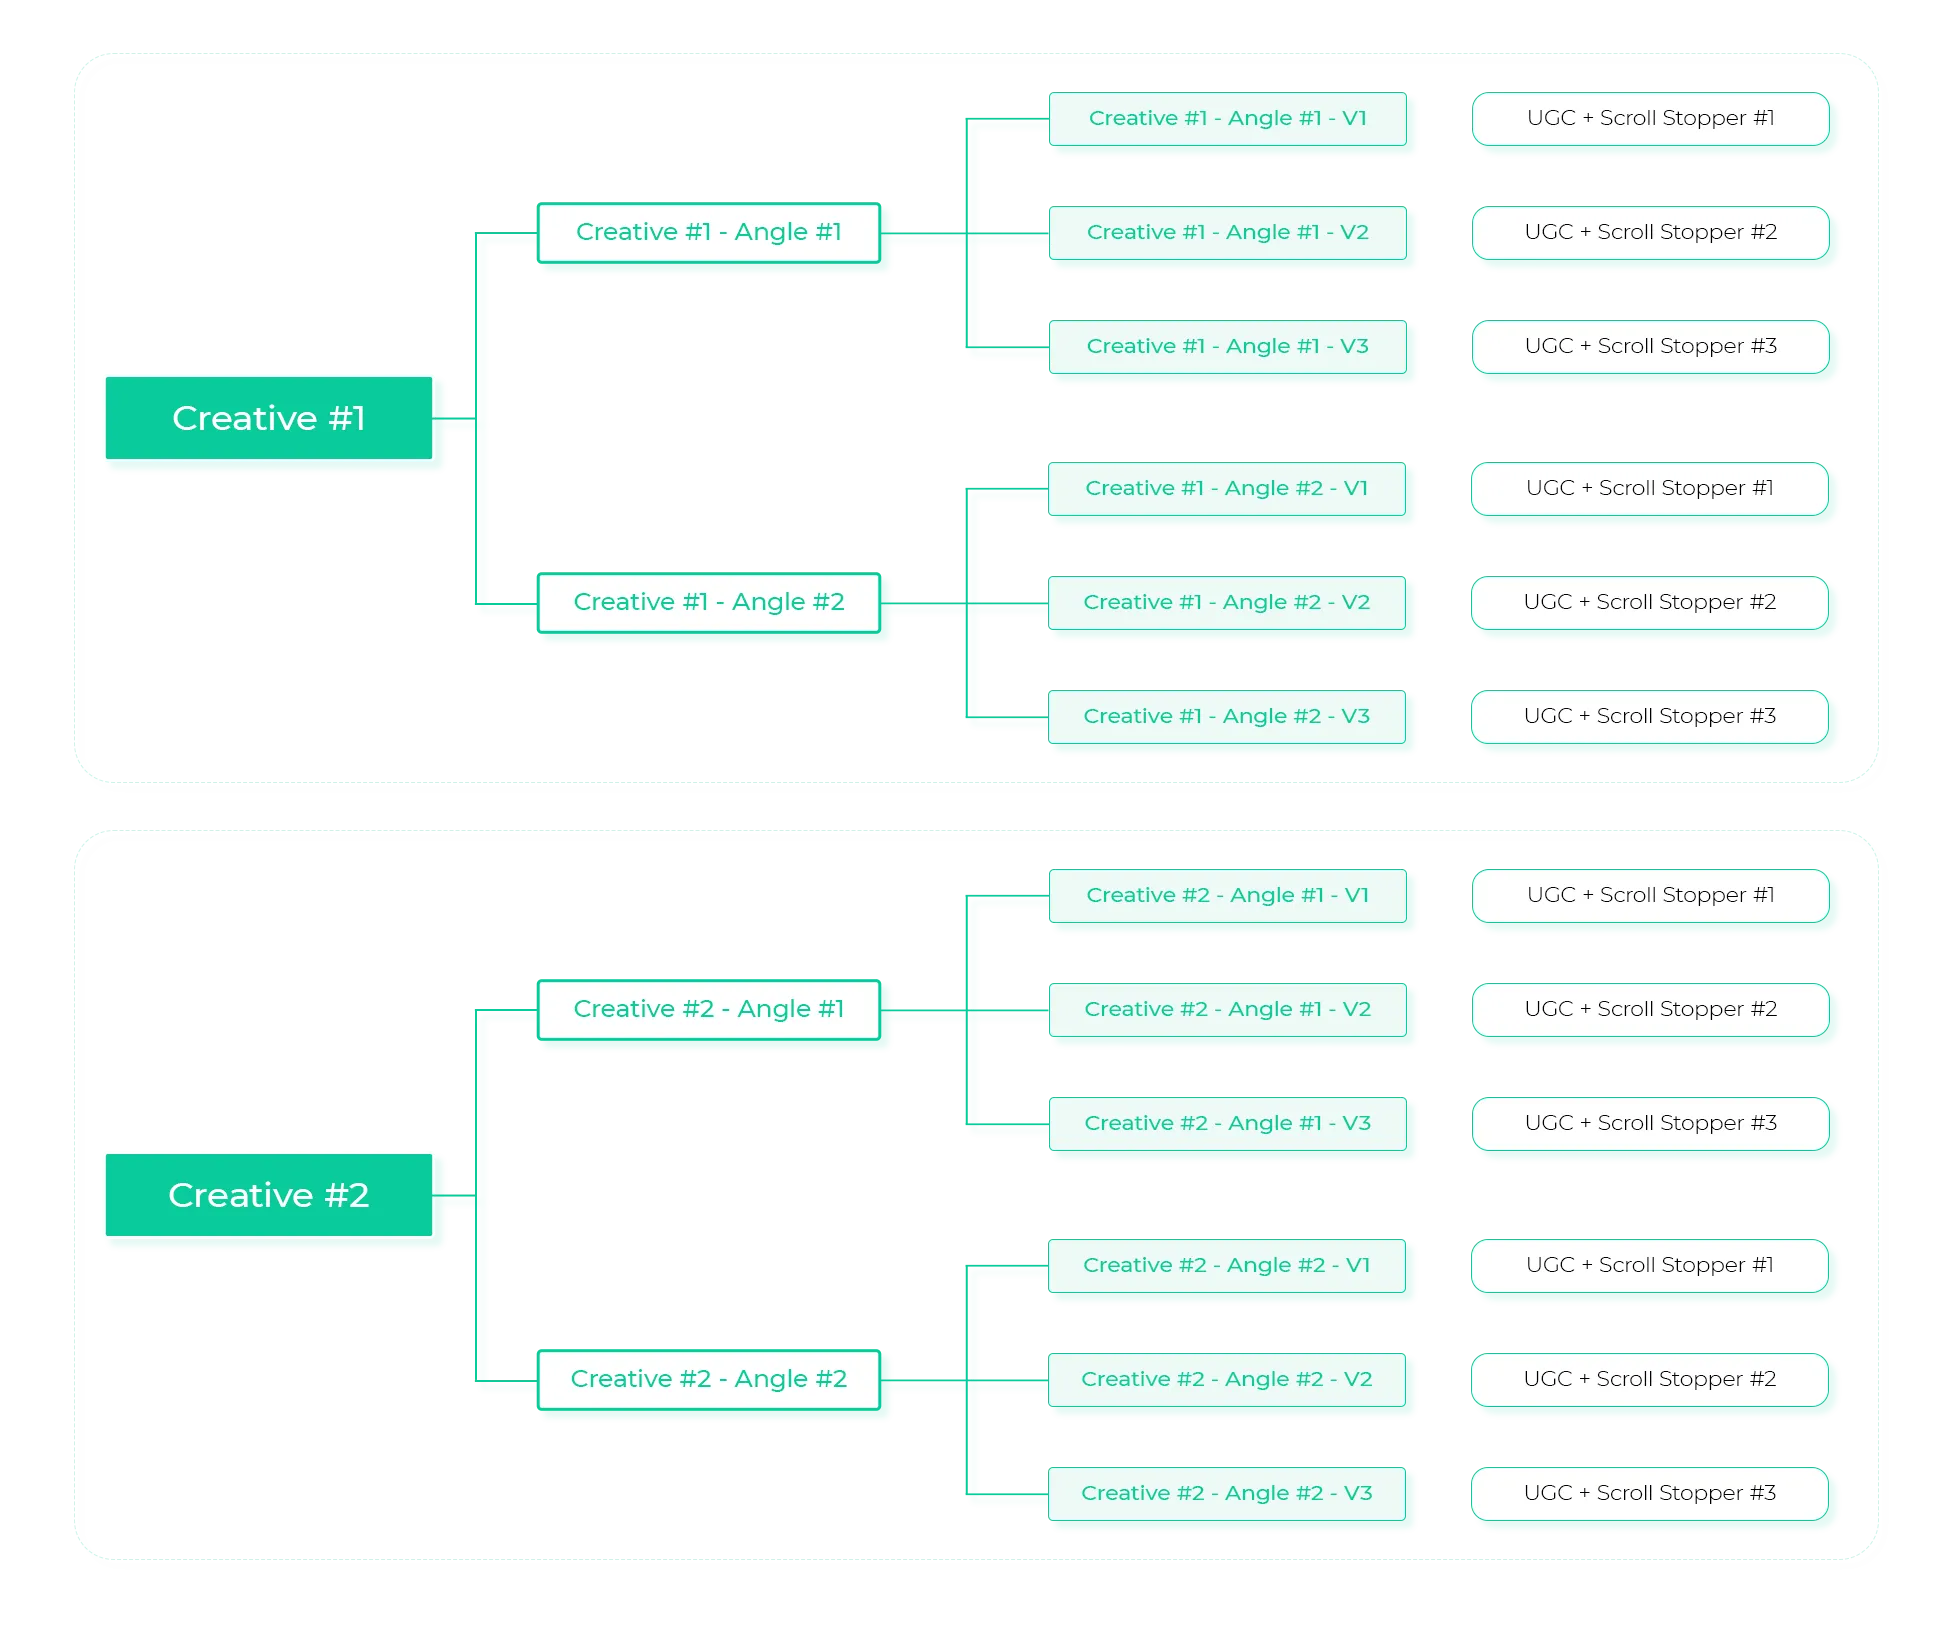 How each creative was broken into angles, versions and UGC hooks for testing.
Media buying.
- Audiences: broad targeting and niche interests such as waxing, shaving and razor brands didn’t work. Large, well-known women’s fashion and lingerie brands did. Lookalikes at 5% worked, and stacking all the winning lookalikes in one ad set gave the best ROAS.
- Creative testing: one ad per ad set, each run against two audiences (a long-term winner and a winner from the last 14 days), on ad-set budgets (ABO).
- Structure: we switched traffic campaigns off because they brought low-quality visitors and diluted the custom audiences, and cut remarketing down to two ad sets (website visitors and add-to-carts). Traffic fell, but remarketing ROAS went up.
Results
| Month (2022) | Store revenue | Conversion rate |
|---|---|---|
| January | £22,063 | 2.30% |
| February | £22,348 | 1.38% |
| March (we start) | £25,312 | 2.40% |
| April | £53,884 | 2.96% |
- Monthly revenue grew from £25,312 in our first month to £53,884 in the second, up 113%.
- The email list grew 30% in under 60 days.
- Conversion rate rose to 2.96% in April and was at 3.05% in May, month to date.
- We doubled the Facebook budget from £8k to almost £15k a month as revenue grew.
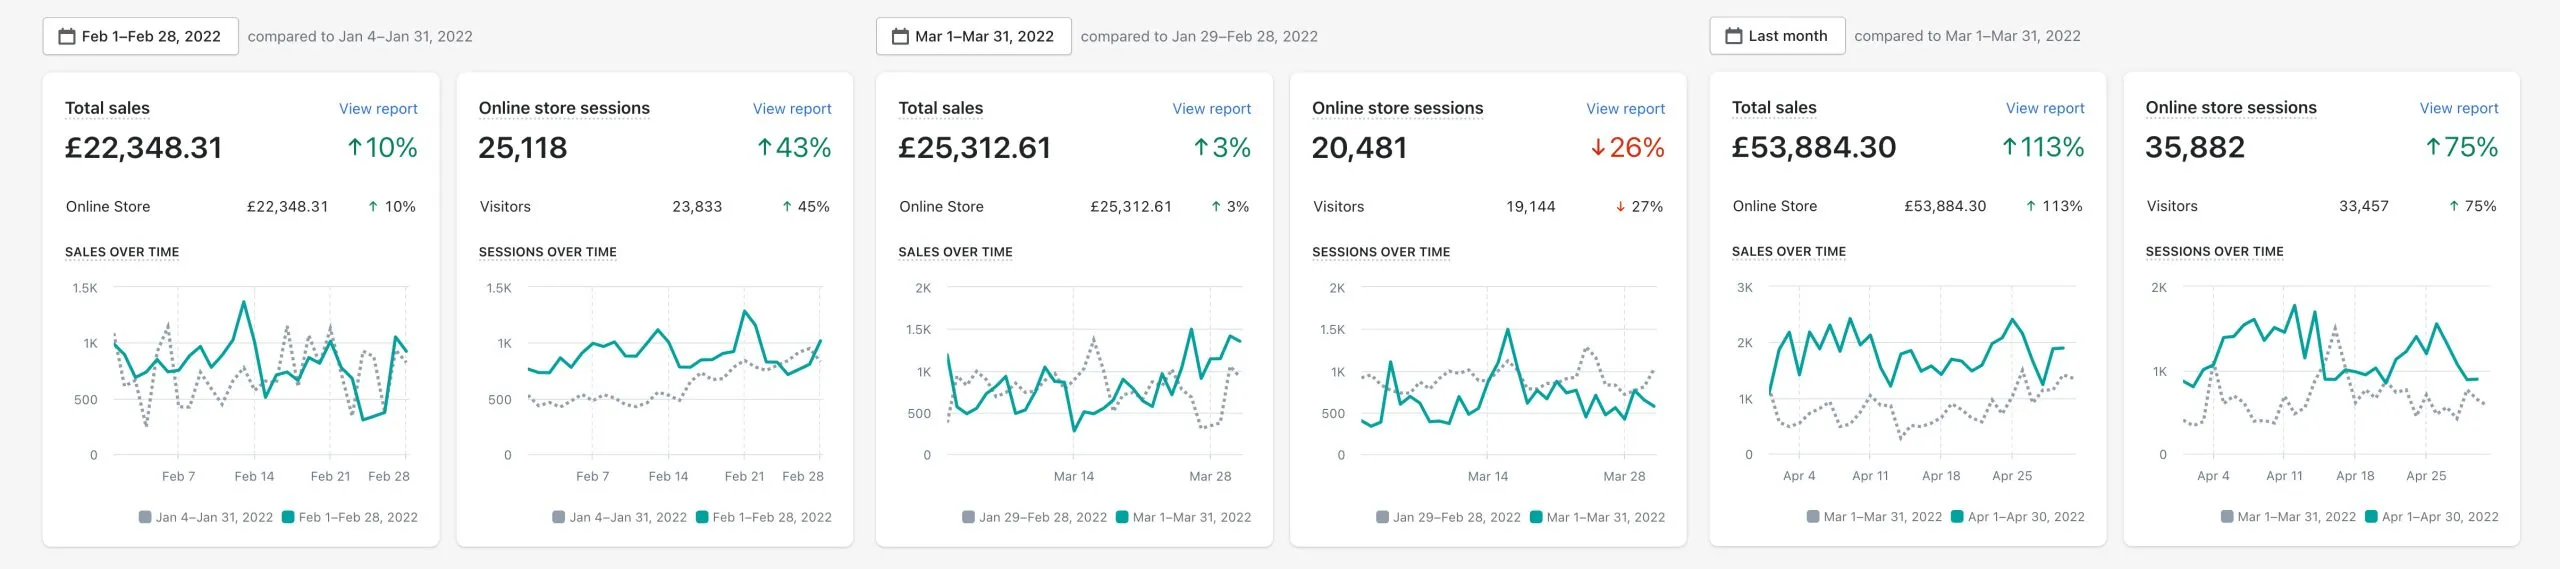 Shopify total sales and sessions for February, March and April 2022.
Notes on the data
Revenue and conversion rate come from Shopify by calendar month, in GBP. March 2022 was the first month of the engagement. The May figure was month to date when the original report was written, so it is not used as a result.